You're about to create your best presentation ever

Presentation Background Database

Create your presentation by reusing one of our great community templates.

DATABASE PRESENTATION

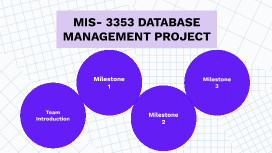
Transcript: MIS- 3353 DATABASE MANAGEMENT PROJECT ShaQuiLe Team Introduction Claire Corley Hunter Stringfellow Chloe Plumley Angela Ha Hannah Hersley Assumptions Client Meeting We made the assumption this food truck does not work 24 hours. We made an assumption that you could only use one discount per purchase. Each customer only has one phone number (No home phones or work phones) We assume that the truck moves depending on the day and has no set location. We assume that each employee is capable of working different shift(cook vs cashier) Customers only have one email on record. ERD Milestone 1 ERD Overview What is an ERD? Why is it necessary? An ERD is a visual representation of how data is stored in a database for easy retrieval and business proceedings. What business cycle was used? We decided to use the revenue and expenditure. This is because the taco truck has an expenditure cycle for purchasing the ingredients and materials and revenue for selling the products. ERD ERD PT 1 ERD ERD PT 2 ERD ERD PT 3 SQL Queries SQL Normilization Milestone 2 Normilization What is normilization and what is the purpose? Normilization Normalization is the process of organizing data within a conceptual database. This translates the conceptual designs into a series of relations, columns, and rows. Normilization of the data provided by the client. We put the assortments of food and combos offered at the taco truck as their own entity, which makes them atomic. Employees, Customers, Wholesale, Purchase Order, Purchase Order Line, Raw Materials, and Product are all considered 3NF, because there is no date duplication and there are no transitive dependencies for non-prime key attributes. Data Dictionary Milestone 3 Implementation Implementation Physical Design What is physical Design and Implementation? Physical Design The physical design is the actual database itself which is used to store and retrieve data for the taco truck. This is implemented for this project through SQL server, and then uses SQL to retrieve the data using queries. What is denormilization? Unlike a Normalized Database, Denormalization adds more specific types of data into the system, which can cause redundancy in some tables. Database Database Challenges What was our biggest challenge? Challenges One of our biggest challenges was correcting the previous stages of the database. As this project has progressed, we have edited the original design several times so that it could run as smoothly as possible, by following feedback and testing query feasibility. Weakness and stregnths? mhk Additional Queries Queries

DATABASE presentation

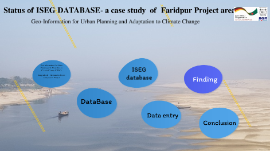
Transcript: Geo-Information for Urban Planning and Adaptation to Climate Change Status of ISEG DATABASE- a case study of Faridpur Project area Contents Geo-Information for Urban Planning and Adaptation to Climate Change (GPAC) Bangladesch – German Technical Cooperation Project Database Data quality ISEG database Data entry Findings Conclusion Database DataBase A database is a collection of information that is organized so that it can be easily accessed, managed and updated. Data is organized into rows, columns and tables, and it is indexed to make it easier to find relevant information. Data Quality Data Quality Data quality is a perception or an assessment of data's suitability to serve its purpose in a given context. Key factors The quality of data is determined by factors such as Data Completeness Data Consistency Data Quality Data Accuracy Data Timeliness Data Uniqueness Data Validity Data completeness refers to whether all available data is present. Borehole data SPT data Geotechnical data Waypoint data Data completeness Importance Importance Poor- quality data is often attached as the source of erroneous reporting and unrealistic approaches. When collecting data, it is important that the data collected are of high quality so that we can be reliably using as the basis to make sound results. To ensure data quality, data control measures must be applied at every stage of the data collection process. ISEG Database ISEG database An open source software ‘PostgreSQL’ database was used to prepare the ISEG database. ‘PostgreSQL’ is the world’s most advanced open source database. Methodology DB Team Key Players Mohammad Feruj Alam, Sarwat Jabeen, Tahera Afrin Md. Khairul Islam Ahmed Shoeb Werner Buchert Data completeness is around 90% All data are consistent Timeliness within November all data should be entered. For PSA accuracy is 90% Each and every BH is Unique. nothing is entered more than once ISEG DB Quality ISEG DB Data entry Processes of data check- Excel table query Checking missing information or identifying suspicious information determine the data accuracy Up to date Data Checking Finding Waypoints Info Photo info Overview of project areas Case study - Faridpur project area Statistical analysis of SPT(N30) SPT info Summary of all collected & tested samples Geotechnical info Waypoints Distance analysis of Waypoints location Map Photo information of the Project area Data Overview of project areas Conclusion These expected grain size analysis test results are 2011 but the actual amount of receiving results are 1807 instead of 2011, as some samples are missing of different depth because of • few samples are damaged during extrusion , • samples are not sufficient to perform test Data accuracy 90% Thank you

Now you can make any subject more engaging and memorable